|
A partir de 13/02/2025 esta página deixará de ser atualizada.
|
Glossário sobre Análise Gráfica
( A-C )
( D-F )
( G-J )
( K-M )
( N-S )
( T-Z )
- T-Statistics
- The probability distribution used to test the hypothesis that a random sample of n observations
comes from a normal population with a given mean.
- T-Test
- A statistical test of significance for a distribution that changes its shape as N gets
smaller; based on a variable t equal to the difference between the mean of the
sample and the mean of the population divided by a result obtained by dividing the
standard deviation of the sample by the square root of the number of individuals in the
sample.
- Tangibles
- Cash equivalents of the futures contracts.
- Technical Analysis
- A form of market analysis that studies demand and supply for securities and commodities
based on trading volume and price studies. Using charts and modeling techniques,
technicians attempt to identify price trends in a market.
- Telegrapher's Equation
- A variation of the Diffusion Equation that describes minor differences in the drunkard's
walk, in which the random decision controls the change in direction rather than the
direction itself.
- Term Structure
- Also known as yield curve. The slope of the term structure is the yield on long-term
government bonds minus the yield on short-term instruments such as Treasury bills.
- Theta
- The measurement of the time decay of a position.
- Thrust
- A comparison between the price difference of successively lower pivot bottoms or higher
pivot tops. For example, a reduction in the difference between pivot bottoms shows loss of
momentum; an increase in the difference shows increased momentum.
- Tick
- The minimum fluctuation of a tradable. For example, bonds trade in 32nds, while most
stocks trade in eighths.
- Tick Indicator
- The number of stocks whose last trade was an uptick or a downtick.
- Time Domain
- Variation of a time series is accounted for by an autocorrelation function and other
time series.
- Time Series
- A collection of observations made sequentially in time and indexed by time.
- Time Value
- The difference between the premium paid for an option and the intrinsic value. As the
option approaches expiration, the time value erodes, eventually to zero.
- TPO
- Time-Price Opportunity; a price that occurs during designated half-hour periods of
trading; a price-time relationship developed for the Chicago Board of Trade's Market
Profile and Liquidity Data Bank reports.
- Trade Facilitation
- Liquidity.
- Trading Bands
- Lines plotted in and around the price structure to form an envelope, answering whether
prices are high or low on a relative basis and forewarning whether to buy or sell by using
indicators to confirm price action.
- Trading Range
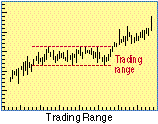
- The difference between the high and low prices traded during a period of time; in
commodities, the high/low price limit established by the exchange for a specific commodity
for any one day's trading.
- Trailing Stop
- A stop-loss order that follows the prevailing price trend.
- Transfer Function
- The mathematical relationship between the output of a control system and its input for a
linear system, it is the Laplace transform of the output divided by the Laplace transform
of the input under conditions of zero initial energy.
- Transfer Response
- Refers to the shape of the wave coming out of a filter in comparison to the shape going
into it.
- Transform
- A process to change or convert. For example, a simple moving average is a filter to
reduce noise; the moving average is the transform function.
- Trend
- The general drift, tendency or bent of a set of statistical data as related to time.
- Trend Channel
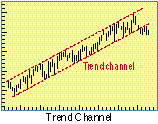
- A parallel probable price range centered about the most likely price line. Historically,
this term has been used to denote the area between the base trendline and the reaction
trendline defined by price moves against the prevailing trend.
- Trend Day
- A day in which the price of a futures contract moves consistently away from the opening
range and does not return to the opening range prior to the close.
- Trend-Following
- Moving in the direction of the prevailing price movement.
- Trending Market
- Price moves in a single direction, generally closing at an extreme for the day.
- Trendless
- Price movement that vacillates to the degree that a clear trend cannot be identified.
- Trendline
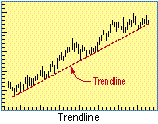
- A line drawn that connects either a series of highs or lows in a trend. The trendline
can represent either support as in an uptrend line or resistance as in a downtrend line.
Consolidations are marked by horizontal trendlines.
- Triangular Moving Average
- A moving average in which each day's data are multiplied by a weight that increases in
value at steady increments to a peak value and then declines to zero at equivalent
increments. The sum of the weighted daily data is divided by the number of variables.
- TRINSee
- Arms Index
- True Range
- The largest of the following: Today's high minus today's low, today's high minus
yesterday's close, today's low minus yesterday's close.
- True Strength Index
- A momentum indicator developed by William Blau that double-smoothes the ratio of the
market momentum to the absolute value of the market momentum.
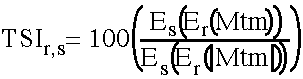
where:
Mtm = one-day change in closing price.
|Mtm| = absolute value of Mtm.
Er = exponential smoothed moving average of r days.
Es = exponential smoothed moving average of s days.
- Turning Point
- The approximate time at which there is a change in trend.
- Tweezers Bottoms and Tops
- Candlestick formations. Both candles must have identical highs and lows. Significant
when found at contract highs or lows, and can indicate a breakout.
- Uncovered Option
- The buy or sale of an option without a position in the underlying futures contract; also
known as a naked option.
- Underlying Instrument
- A trading instrument subject to purchase upon exercise.
- Underlying Security
- In options, a stock subject to purchase upon exercise of the option.
- Univariate
- Involving only one variable.
- Upthrust
- Occurs when price moves above a pivot top and a widespread reversal ensues as follows:
a) two previous closes are reversed, b) close is below pivot top, c) close is below
opening and mid-range, d) daily price range is greater than the previous day's range.
- Value Area
- The price range on the CBOT Market Profile in which approximately 70% of the day's
trades occur.
- Value-Weighted Index
- A market average such as Standard & Poor's 500 Index that takes into account the
market value of each security rather than calculating a straight price average.
- Variable-Length Moving Average
- A moving average where the number of periods selected for smoothing is based on a
volatility measurement of price. Typically, the standard deviation of price is used to
measure price volatility. The more volatile the price is, the shorter the number of
periods used is for smoothing.
- Vega
- The amount by which the price of an option changes when the volatility changes.
- Vertical Spread
- A stock option spread based on simultaneous purchase and sale of options on the same
underlying stock with the same expiration months but different strike prices.
- Volatility
- A measure of a stock's tendency to move up and down in price, based on its daily price
history over the latest 12 months.
- Volume Price Trend (VPT)
- In which a running sum is maintained when a day's total volume is added if the market
closes positive or the day's total volume is subtracted if the market closes lower. See
On-balance volume.
- Wasting
- A term depicting how an option's value decreases over time; as each day after
acquisition passes a portion of the option's time value is lost or wasted.
- Wave
- In Elliott wave theory, a sustained move by a market's price in one direction as
determined by the reversal points that initiated and terminated it.
- Wave Cycle
- An impulse wave followed by a correction wave, the impulse wave being made up of five
smaller, numbered waves of alternating direction designated 1, 2, 3, 4 and 5, and the
correction wave being composed of three smaller alternating waves designated a, b, and c.
- Weighted Industry Index
- An index where the importance of each stock is related to its market capitalization.
- Whiplash
- Alternating buy and sell signals that result in losses.
- Whipsaw
- Losing money on both sides of a price swing.
- Wildcards
- Characters in a quote symbol or Dos file name that indicates an undefined, but
categorized, value.
- Williams' %R
- Overbought and oversold indicator that is used to determine market entry and exit
points.
- Yates's Correction
- When a small amount of data is available for testing, the chi-square formula is adjusted
to account for the small sample base.
- Zero-Coupon Government Bonds
- Government bonds that are purchased at a deep discount and pay no cash dividend, unlike
regular bonds.
- Zeta
- The percentage change in an options price per 1% change in implied volatility.
- Zigzag
- In a bull market, an Elliott three-wave pattern that subdivides into a 5-3-5 pattern
with the top of wave B noticeably lower than the start of wave A. In a bear market, this
pattern will be inverted.
( A-C )
( D-F )
( G-J )
( K-M )
( N-S )
( T-Z )
|